CAEP Review
The University of Nebraska at Lincoln educator preparation program is accredited by the Council for the Accreditation of Educator Preparation (CAEP). This accreditation certifies that the University of Nebraska at Lincoln has provided evidence that it adheres to CAEP’s standards. More information can be found on the CAEP website.
The University of Nebraska at Lincoln (UNL) educator preparation program is composed of seven departments. The singular goal is to provide quality educator preparation programs for teaching, educational administration, and related service careers in education, equipping completers to enhance the lives of individuals, families, schools and communities. The UNL program prepares its completers to serve all learners, including those who face opportunity gaps, in a variety of educational environments.
With an emphasis on collaboration among programs, colleges and stakeholder groups, the UNL educator preparation program offers degree, certification and endorsement programs at the initial and advanced levels with multiple field and clinical experiences. UNL offers initial and advanced educator preparation programs.
The Data
ENDORSEMENT PROGRAM ACCREDITATION
Initial Licensure Programs
| Program | Grade Bands |
| Agricultural Education | 6-12 |
| Biology | 7-12 |
| Business, Marketing & Information Technology | 6-12 |
| Chemistry | 7-12 |
| Early Childhood Inclusive | Birth-Grade 3 |
| Earth & Space Science | 7-12 |
| Elementary Education | K-6 |
| English Language Arts | 7-12 |
| Family & Consumer Sciences Occupational | 6-12 |
| Math | 6-12 |
| Music | PK-12 |
| Physics | 7-12 |
| School Psychologist | PK-12 |
| Science | 7-12 |
| Secondary English | 6-12 |
| Skilled & Technical Sciences | 6-12 |
| Social Sciences | 6-12 |
| Special Education Generalist | 6-12, K-8, K-12 |
| Special Education Early Childhood | Birth – PK |
| Speech Language Pathology | B-Age 21 |
| World Language (Spanish, Chinese, French, German, Russian, Latin, Japanese & Arabic) | 6-12 |
Advanced Licensure Programs
| Endorsement Programs | Grade Bands |
| Bilingual Education | PK-6, 7-12 |
| Coaching | 9-12 |
| Early Childhood Education | PK-3 |
| English as a Second Language | PK-6, 7-12 |
| Health Sciences Education | 6-12 |
| Information Technology | PK-12 |
| Instructional Technology Leadership | PK-12 |
| Journalism & Media Education | 7-12 |
| Orientation & Mobility Specialist (Special Services permit) | B-21 |
| Principal | PK-12, PK-8, 7-12 |
| Reading Specialist | PK-12 |
| Skilled & Technical Sciences Education -Skilled Specific | 9-12 |
| Special Education Behavior Intervention Specialist | B-12 |
| Special Education Deaf or Hard of Hearing | B-12 |
| Special Education Early Intervention Specialist | B-PK |
| Special Education Supervisor | B-12 |
| Special Education Visual Impairment | B-12 |
| Speech | 7-12 |
| Superintendent | PK-12 |
| Theatre | 7-12 |
| Work-Based Learning | 9-12 |
DEPARTMENTS
Seven departments are engaged in preparing our future educators.
- Teaching, Learning and Teacher Education (TLTE)
- Special Education and Communication Disorders (SECD)
- Child, Youth and Family Studies (CYAF)
- Educational Administration (EDAD)
- Educational Psychology (EDPS)
- Music Education (Glen Korff School of Music)
- Agricultural Education (Institute of Agriculture & Natural Resources)
- Skilled & Technical Sciences (Institute of Agriculture & Natural Resources)
See our accreditation page for more information.
ACCREDITATIONS
Accreditation helps separate UNL from other teacher preparation programs.
Why?
- It assists with quality assurance through external peer review.
- Provides standards for what new teachers need to know and experience to enter as classroom-ready teachers.
- Promotes continuous improvement and program self-assessment.
- Connects with national and state accountability systems.
- Supports quality preparation.
Accredited Programs
- Educator Preparation Programs – Council for the Accreditation of Educator Preparation (CAEP) and Nebraska Department of Education.
- School Psychology – The Ph.D. in school psychology is accredited by the Commission on Accreditation of the American Psychological Association, and the Ph.D. and Ed.S. in school psychology are approved by the National Association of School Psychologists.
- Speech Language Pathology – The M.S. in speech-language pathology and the Au.D. in audiology are accredited by the Council on Academic Accreditation in Audiology and Speech-Language Pathology of the American Speech-Language-Hearing Association (ASHA)
- Music Education – The Bachelor’s and Master’s in Music Education are accredited by the National Association of Schools of Music.
See our accreditation page for more information.
MEASURE 1: COMPLETER IMPACT AND EFFECTIVENESS
The Nebraska Department of Education (NDE) collects data each year from first- and third-year teachers and their employers for initial programs. The collected data is an indicator of teacher effectiveness based on InTasc standards as reported by both the teacher and the principal. The EPP participated in a NDE committee to develop a state survey to collect completed impact and effectiveness for advanced programs and is designing its own based on the state draft. Implementation will be Fall 2026.
UNL and State survey response rates.
Assessor | Survey Type | UNL Response Rate | State Response Rate |
Principals | 1st Year Teacher Survey | 67% | 67% |
Principals | 3rd Year Teacher Survey | 61% | 67% |
Teachers | 1st year Teacher Survey | 45% | 47% |
Teachers | 3rd Year Teacher Survey | 42% | 43% |
First year teachers employed in the 2024-2025 school year are May and August 2024 initial program completers.
Third year teachers employed in the 2024-2025 school year were May/August initial program completers.
Completer Effectiveness
1st year Teacher (2024-2025 School Year)
Would you consider this teacher effectively prepared for continuing employment in your district? | |||
|---|---|---|---|
N | Yes | No | |
| UNL FYT by Principal | 120 | 117 | 3 |
Do you believe you were prepared to be an effective 1st year teacher? | |||
|---|---|---|---|
| N | Yes | No |
| UNL FYT by Teacher | 80 | 66 | 14 |
Summary of 1st Year Teacher Survey (2024-2025 School Year):
Principal responses indicate that UNL teachers are effectively prepared (98%). Data illustrates the majority of first year teacher respondents felt effectively prepared (82.5%). Survey results indicate that completers and employers agree the EPP effectively prepares first year teachers
3rd Year Teacher (2024-2025 School Year)
Would you consider this teacher effectively prepared for continuing employment in your district? | |||
|---|---|---|---|
| N | Yes | No |
UNL TYT by Principal | 90 | 88 | 2 |
Do you believe you were prepared to be an effective 3rd year teacher? | |||
|---|---|---|---|
| N | Yes | No |
UNL TYT by Teacher | 62 | 54 | 8 |
Summary of 3rd Year Teacher Survey (2024-2025 School Year):
Principal responses indicate that UNL third year teachers are effectively prepared (97.7%). Data illustrates that most third-year teachers felt effectively prepared (87%). Survey results illustrate that completers and employers agree the EPP preparation is effective for third year teachers.
Impact on P-12 Learning
1st year Teacher (2024-2025 School Year)
Based upon the performance of this first-year teacher, how would you rate his/her impact on student learning? | |||||
|---|---|---|---|---|---|
| N | Ineffective | Somewhat Effective | Moderately Effective | Highly Effective |
UNL FYT by Principal | 120 | 2 | 11 | 51 | 56 |
Based upon your performance as a first-year teacher, how would you rate your impact on student learning? | |||||
|---|---|---|---|---|---|
| N | Ineffective | Somewhat Effective | Moderately Effective | Highly Effective |
UNL FYT by Teacher | 80 | 0 | 6 | 55 | 19 |
Summary of 1st Year Teacher Survey (2024-2025 School Year):
Principal responses indicate that UNL prepared teachers positively impact student learning in their first year of employment at moderately or highly effective levels (89.1%). First-year teacher results reflect a positive student impact at a moderately or highly effective level (92.5%). Survey results illustrate that the EPP effectively prepares first year teachers to positively impact student learning.
3rd Year Teacher Survey (2024-2025 School Year)
Based upon the performance of this third-year teacher, how would you rate his/her impact on student learning? | |||||
|---|---|---|---|---|---|
| N | Ineffective | Somewhat Effective | Moderately Effective | Highly Effective |
UNL TYT by Principal | 90 | 1 | 8 | 37 | 44 |
Based upon your performance as a third-year teacher, how would you rate your impact on student learning? | |||||
|---|---|---|---|---|---|
| N | Ineffective | Somewhat Effective | Moderately Effective | Highly Effective |
UNL TYT by Teacher | 62 | 0 | 3 | 38 | 21 |
Summary of 3rd Year Survey (2024-2025 School Year):
Principal responses indicate that UNL prepared teachers positively impact student learning in their third year of employment at moderately or highly effective levels (95.1%). Third-year teacher results reflect a positive student impact at a moderately or highly effective level (90%). Survey results reflect that the EPP effectively prepares teachers to have a positive impact on student learning in their third year of employment.
MEASURE 2. SATISFACTION OF EMPLOYERS AND STAKEHOLDER INVOLVEMENT
The Nebraska Department of Education (NDE) administers the Nebraska First Year Teacher Survey and Third Year Survey to both principals and to 1st and 3rd year teachers (Spring 2025). Indicators are based on the Interstate Teacher Assessment and Support Consortium (InTASC) Model Core Teaching Standards.
| 1st Year Teacher Response | 3rd year Teacher Response | |||
|---|---|---|---|---|
| UNL | State | UNL | State | |
| Teachers | 44.94% | 47.36% | 41.89% | 42.93% |
| Principals | 67.04% | 67.00% | 61.22% | 67.41% |
First Year Employer Impact
| N | Percentage | |
|---|---|---|
| Highly Effective | 56 | 46.7% |
| Moderately Effective | 51 | 42.5% |
| Somewhat Effective | 11 | 9.2% |
| Ineffective | 2 | 1.7% |
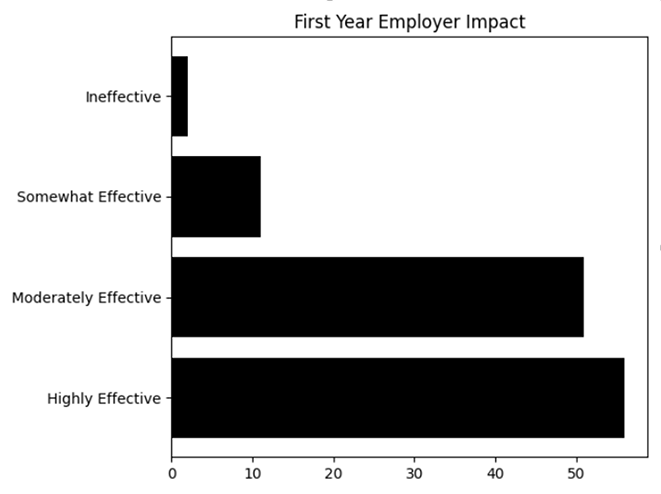
Summary: 89.2% of respondents provided positive ratings for first year employer impact, indicating strong satisfaction and evidence of candidate effectiveness.
First Year Completer Impact
| N | Percentage | |
| Highly Effective | 19 | 23.8% |
| Moderately Effective | 55 | 68.8% |
| Somewhat Effective | 6 | 7.5% |
| Ineffective | 0 | 0.0% |
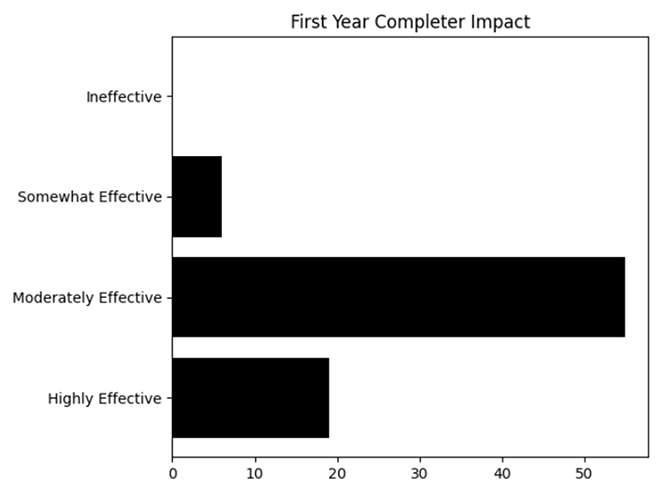
Summary: 92.6% of respondents provided positive ratings for first year completer impact, indicating strong satisfaction and evidence of candidate effectiveness.
First Year Employer Preparedness
| N | Percentage | |
|---|---|---|
| Yes | 117 | 97.5% |
| No | 3 | 2.5% |
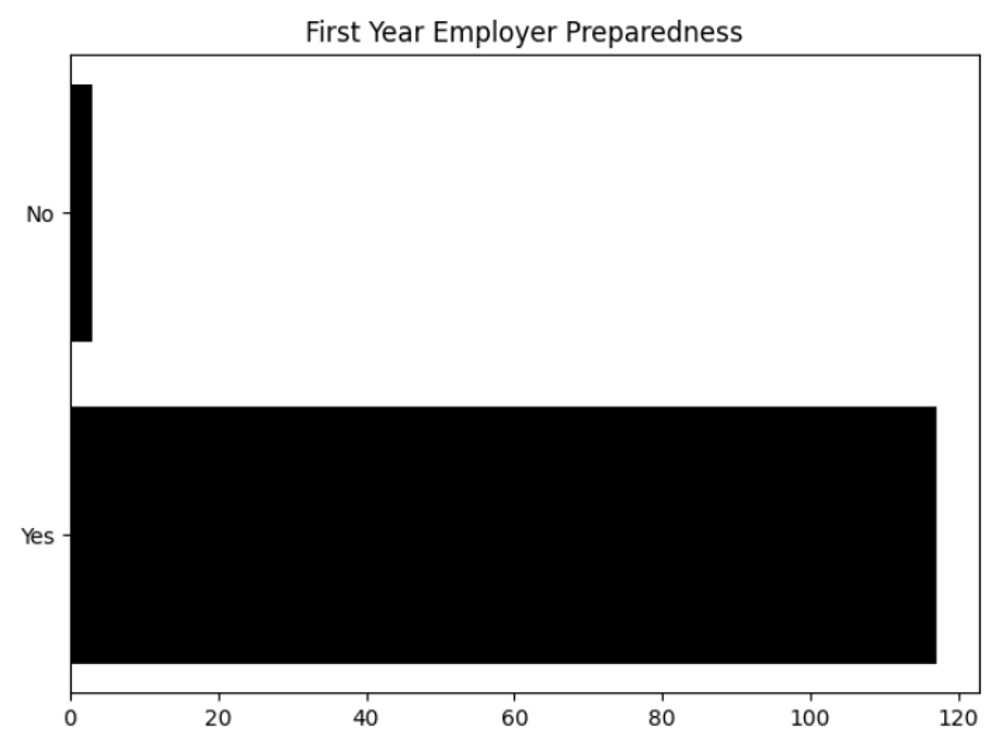
Summary: 97.5% of respondents provided positive ratings for first year employer preparedness, indicating strong satisfaction and evidence of candidate effectiveness.
First Year Completer Preparedness
| N | Percentage | |
|---|---|---|
| Yes | 66 | 82.5% |
| No | 14 | 17.5% |
Stakeholder Involvement
UNL values its stakeholders and has partnerships with numerous schools in the preparation of its candidates. These partnerships result in a variety of field and clinical experiences.
The Professional Education Committee (PEC) is the formal stakeholder group of the educator preparation program. Composed of external stakeholders (school district administrators in varying positions, teachers and post-secondary faculty from other UNL colleges) this group meets three times a year to discuss annual program reporting and data review, performance, employability, address questions and/or concerns and discuss any emergent issues.
MEASURE 3. CANDIDATE COMPETENCY AT COMPLETION
The Nebraska Department of Education (NDE) administers the Nebraska First Year Teacher Survey and Third Year Survey to both principals and to 1st and 3rd year teachers (Spring 2025). Indicators are based on the Interstate Teacher Assessment and Support Consortium (InTASC) Model Core Teaching Standards.
| 1st Year Teacher Response | 3rd year Teacher Response | |||
| UNL | State | UNL | State | |
| Teachers | 44.94% | 47.36% | 41.89% | 42.93% |
| Principals | 67.04% | 67.00% | 61.22% | 67.41% |
1st year Teacher Survey Responses by Principals (N=120)
| NDE Standards | Assessment Rubric Description | Advanced | Proficient | Developing | Below Standard |
|---|---|---|---|---|---|
% | % | % | % | ||
| Standard 1 Learner Development | Uses knowledge of students and their development and adjusts teaching to facilitate student learning. | 19.17% | 60.83% | 20.00% | 0.00% |
| Builds on student strengths to facilitate learning. | 20.00% | 55.00% | 23.33% | 1.67% | |
| Standard 2 Learner Differences | Can identify differentiation in student needs. | 19.17% | 56.67% | 24.17% | 0.00% |
| Responds to differentiation in student needs with individualized instruction and varied learning experiences. | 19.17% | 45.83% | 33.33% | 1.67% | |
| Brings multiple perspectives and cultural resources to content and discussions. | 18.33% | 55.83% | 25.00% | 0.83% | |
| Standard 3 Learning Environments | Promotes a positive classroom environment. | 32.50% | 54.17% | 12.50% | 0.83% |
| Uses and communicates clear task and behavioral expectations to support an environment of learning. | 28.33% | 51.67% | 19.17% | 0.83% | |
| Standard 4 Content Knowledge | Uses and communicates content knowledge. | 24.17% | 61.67% | 14.17% | 0.00% |
| Uses academic vocabulary and grammar. | 23.33% | 67.50% | 9.17% | 0.00% | |
| Provides opportunities for students to demonstrate their content knowledge. | 21.67% | 65.00% | 12.50% | 0.83% | |
| Standard 5 Application of Content | Helps students link concepts and engage in critical thinking. | 13.33% | 59.17% | 26.67% | 0.83% |
| Engages students in the development of literacy and communication skills. | 17.50% | 63.33% | 18.33% | 0.83% | |
| Standard 6 Assessment | Matches instructions and assessments to learning objectives. | 23.33% | 61.67% | 15.00% | 0.00% |
| Uses formative and summative classroom assessments that facilitate learning. | 20.00% | 62.50% | 16.67% | 0.83% | |
| Amends instructional strategies and adapts interventions as needed. | 19.17% | 51.67% | 27.50% | 1.67% | |
| Provides differentiated instruction and assessments that positively impact learning. | 18.33% | 52.50% | 26.67% | 2.50% | |
| Standard 7 Planning for Instruction | Plans sequenced learning experiences and performance tasks linked to learning objectives. | 17.50% | 67.50% | 12.50% | 2.50% |
| Plans and implements multiple ways for students to demonstrate their knowledge and skills. | 15.83% | 65.00% | 16.67% | 2.50% | |
| Standard 8 Instructional Strategies | Incorporates digital tools and technologies into instruction. | 20.83% | 67.50% | 11.67% | 0.00% |
| Uses evidence-based strategies to support critical thinking and content learning. | 14.17% | 64.17% | 20.83% | 0.83% | |
| Organizes and manages the learning environment to maximize student engagement. | 24.17% | 53.33% | 19.17% | 3.33% | |
| Standard 9 Professional Learning and Ethical Practice | Invites constructive feedback and responds positively. | 35.00% | 50.00% | 15.00% | 0.00% |
| Sets and implements goals to improve practice. | 23.33% | 56.67% | 18.33% | 1.67% | |
| Standard 10 Leadership and Collaboration | Communicates professionally - oral, written, and electronic. | 25.00% | 62.50% | 11.67% | 0.83% |
| Responds to people, problems, and crises effectively. | 20.00% | 62.50% | 16.67% | 0.83% |
1st year Teacher Survey Responses by Teachers (N=80)
| NDE Standards | Assessment Rubric Description | Advanced | Proficient | Developing | Below Standard |
|---|---|---|---|---|---|
% | % | % | % | ||
| Standard 1 Learner Development | Uses knowledge of students and their development and adjusts teaching to facilitate student learning. | 17.50% | 65.00% | 16.25% | 1.25% |
| Builds on student strengths to facilitate learning. | 18.75% | 65.00% | 16.25% | 0.00% | |
| Standard 2 Learner Differences | Can identify differentiation in student needs. | 27.50% | 48.75% | 22.50% | 1.25% |
| Responds to differentiation in student needs with individualized instruction and varied learning experiences. | 21.25% | 42.50% | 33.75% | 2.50% | |
| Brings multiple perspectives and cultural resources to content and discussions. | 27.50% | 48.75% | 21.25% | 2.50% | |
| Standard 3 Learning Environments | Promotes a positive classroom environment. | 48.75% | 43.75% | 6.25% | 1.25% |
| Uses and communicates clear task and behavioral expectations to support an environment of learning. | 26.25% | 57.50% | 13.75% | 2.50% | |
| Standard 4 Content Knowledge | Uses and communicates content knowledge. | 17.50% | 66.25% | 15.00% | 1.25% |
| Uses academic vocabulary and grammar. | 23.75% | 62.50% | 10.00% | 3.75% | |
| Provides opportunities for students to demonstrate their content knowledge. | 26.25% | 56.25% | 16.25% | 1.25% | |
| Standard 5 Application of Content | Helps students link concepts and engage in critical thinking. | 15.00% | 58.75% | 23.75% | 2.50% |
| Engages students in the development of literacy and communication skills. | 16.25% | 62.50% | 21.25% | 0.00% | |
| Standard 6 Assessment | Matches instructions and assessments to learning objectives. | 26.25% | 57.50% | 12.50% | 3.75% |
| Uses formative and summative classroom assessments that facilitate learning. | 22.50% | 53.75% | 21.25% | 2.50% | |
| Amends instructional strategies and adapts interventions as needed. | 18.75% | 51.25% | 26.25% | 3.75% | |
| Provides differentiated instruction and assessments that positively impact learning. | 17.50% | 53.75% | 25.00% | 3.75% | |
| Standard 7 Planning for Instruction | Plans sequenced learning experiences and performance tasks linked to learning objectives. | 23.75% | 53.75% | 20.00% | 2.50% |
| Plans and implements multiple ways for students to demonstrate their knowledge and skills. | 20.00% | 61.25% | 16.25% | 2.50% | |
| Standard 8 Instructional Strategies | Incorporates digital tools and technologies into instruction. | 36.25% | 41.25% | 20.00% | 2.50% |
| Uses evidence-based strategies to support critical thinking and content learning. | 22.50% | 57.50% | 17.50% | 2.50% | |
| Organizes and manages the learning environment to maximize student engagement. | 26.25% | 56.25% | 13.75% | 3.75% | |
| Standard 9 Professional Learning and Ethical Practice | Invites constructive feedback and responds positively. | 38.75% | 51.25% | 8.75% | 1.25% |
| Sets and implements goals to improve practice. | 35.00% | 46.25% | 17.50% | 1.25% | |
| Standard 10 Leadership and Collaboration | Communicates professionally - oral, written, and electronic. | 40.00% | 46.25% | 11.25% | 2.50% |
| Responds to people, problems, and crises effectively. | 30.00% | 42.50% | 23.75% | 3.75% |
3rd year Teacher Survey Responses by Principals (N=90)
| NDE Standards | Advanced | Proficient | Developing | Below Standard | |
|---|---|---|---|---|---|
% | % | % | % | ||
| Standard 1 Learner Development | Use knowledge of students and their development and adjust teaching to facilitate learning. | 21.11% | 63.33% | 15.56% | 0.00% |
| Build on student strengths to facilitate learning. | 18.89% | 64.44% | 15.56% | 1.11% | |
| Standard 2 Learner Differences | Identify differentiation in student. | 16.67% | 71.11% | 11.11% | 1.11% |
| Respond to differentiation in student needs with individualized instruction and varied learning experiences. | 17.78% | 60.00% | 21.11% | 1.11% | |
| Bring multiple perspectives and cultural resource to content and discussions. | 20.00% | 61.11% | 17.78% | 1.11% | |
| Standard 3 Learning Environments | Promote a positive classroom environment. | 42.22% | 45.56% | 11.11% | 1.11% |
| Use and communicate clear task and behavioral expectations to support an environment of learning. | 31.11% | 50.00% | 16.67% | 2.22% | |
| Standard 4 Content Knowledge | Use and communicate content knowledge. | 25.56% | 67.78% | 6.67% | 0.00% |
| Use academic vocabulary and grammar. | 23.33% | 72.22% | 4.44% | 0.00% | |
| Provide opportunities for students to demonstrate their content knowledge. | 30.00% | 61.11% | 8.89% | 0.00% | |
| Standard 5 Application of Content | Help students link concepts and engage in critical thinking. | 17.78% | 61.11% | 20.00% | 1.11% |
| Engage students in the development of literacy and communication skills. | 17.78% | 68.89% | 12.22% | 1.11% | |
| Standard 6 Assessment | Match instructions and assessments to learning objectives. | 23.33% | 62.22% | 13.33% | 1.11% |
| Use formative and summative classroom assessments that facilitate learning. | 25.56% | 61.11% | 13.33% | 0.00% | |
| Amend instructional strategies and adapt interventions as needed. | 20.00% | 63.33% | 16.67% | 0.00% | |
| Provide differentiated instruction and assessments that positively impact learning. | 20.00% | 60.00% | 20.00% | 0.00% | |
| Standard 7 Planning for Instruction | Plan sequenced learning experiences and performance tasks linked to learning objectives. | 27.78% | 61.11% | 11.11% | 0.00% |
| Plan and implement multiple ways for students to demonstrate their knowledge and skills. | 20.00% | 67.78% | 12.22% | 0.00% | |
| Standard 8 Instructional Strategies | Incorporate digital tools and technologies into instruction. | 27.78% | 61.11% | 10.00% | 1.11% |
| Use evidence-based strategies to support critical thinking and content learning. | 22.22% | 63.33% | 13.33% | 1.11% | |
| Organized and manage the learning environment to maximize student engagement. | 25.56% | 55.56% | 16.67% | 2.22% | |
| Standard 9 Professional Learning and Ethical Practice | Invite constructive feedback and respond positively. | 25.56% | 63.33% | 10.00% | 1.11% |
| Set and implement goals to improve practice. | 18.89% | 67.78% | 12.22% | 1.11% | |
| Standard 10 Leadership and Collaboration | Communicate professionally – oral, written, and electronic. | 28.89% | 61.11% | 8.89% | 1.11% |
| Responds to people, problems, and crises effectively. | 25.56% | 57.78% | 15.56% | 1.11% |
3rd year Teacher Survey Responses by Teachers (N=62)
| NDE Standards | Assessment Rubric Description | Advanced | Proficient | Developing | Below Standard |
|---|---|---|---|---|---|
% | % | % | % | ||
| Standard 1 Learner Development | Use knowledge of students and their development and adjust teaching to facilitate learning. | 14.52% | 61.29% | 22.58% | 1.61% |
| Build on student strengths to facilitate learning. | 17.74% | 66.13% | 14.52% | 1.61% | |
| Standard 2 Learner Differences | Identify differentiation in student. | 14.52% | 54.84% | 27.42% | 3.23% |
| Respond to differentiation in student needs with individualized instruction and varied learning experiences. | 9.68% | 50.00% | 33.87% | 6.45% | |
| Bring multiple perspectives and cultural resource to content and discussions. | 16.13% | 62.90% | 19.35% | 1.61% | |
| Standard 3 Learning Environments | Promote a positive classroom environment. | 46.77% | 43.55% | 9.68% | 0.00% |
| Use and communicate clear task and behavioral expectations to support an environment of learning. | 27.42% | 48.39% | 14.52% | 9.68% | |
| Standard 4 Content Knowledge | Use and communicate content knowledge. | 24.19% | 62.90% | 12.90% | 0.00% |
| Use academic vocabulary and grammar. | 27.42% | 56.45% | 14.52% | 1.61% | |
| Provide opportunities for students to demonstrate their content knowledge. | 19.35% | 66.13% | 12.90% | 1.61% | |
| Standard 5 Application of Content | Help students link concepts and engage in critical thinking. | 14.52% | 67.74% | 12.90% | 4.84% |
| Engage students in the development of literacy and communication skills. | 16.13% | 59.68% | 20.97% | 3.23% | |
| Standard 6 Assessment | Match instructions and assessments to learning objectives. | 14.52% | 64.52% | 19.35% | 1.61% |
| Use formative and summative classroom assessments that facilitate learning. | 20.97% | 62.90% | 14.52% | 1.61% | |
| Amend instructional strategies and adapt interventions as needed. | 14.52% | 54.84% | 24.19% | 6.45% | |
| Provide differentiated instruction and assessments that positively impact learning. | 9.68% | 62.90% | 22.58% | 4.84% | |
| Standard 7 Planning for Instruction | Plan sequenced learning experiences and performance tasks linked to learning objectives. | 27.42% | 62.90% | 8.06% | 1.61% |
| Plan and implement multiple ways for students to demonstrate their knowledge and skills. | 22.58% | 54.84% | 19.35% | 3.23% | |
| Standard 8 Instructional Strategies | Incorporate digital tools and technologies into instruction. | 27.42% | 54.84% | 17.74% | 0.00% |
| Use evidence-based strategies to support critical thinking and content learning. | 14.52% | 62.90% | 20.97% | 1.61% | |
| Organized and manage the learning environment to maximize student engagement. | 19.35% | 56.45% | 19.35% | 4.84% | |
| Standard 9 Professional Learning and Ethical Practice | Invite constructive feedback and respond positively. | 25.81% | 59.68% | 12.90% | 1.61% |
| Set and implement goals to improve practice. | 24.19% | 64.52% | 11.29% | 0.00% | |
| Standard 10 Leadership and Collaboration | Communicate professionally – oral, written, and electronic. | 40.32% | 54.84% | 4.84% | 0.00% |
| Responds to people, problems, and crises effectively. | 30.65% | 48.39% | 16.13% | 4.84% |
Summary: Candidates and employers provide consistent ratings at the proficient or advanced level in all standard areas reflecting competency as a classroom teacher.
Data collection for advanced completer and employer satisfaction will be implemented in 2026-2027. The state advanced program survey implementation was delayed, resulting in a delay in EPP data collection. As a result, the EPP has pivoted in its response to address this data gap and will develop an advanced completer and employer survey for implementation in 2026-2027.
MEASURE 4. ABILITY OF COMPLETERS TO BE HIRED
Candidates who complete the UNL educator preparation program have a high rate of employment in the area in which they were prepared and pursuing licensure in both Nebraska and other states. The data illustrates the employability of initial and advanced program completers for positions for which they have been prepared. Completer data for those who have not chosen employment or licensure, are pursuing other opportunities or who have not notified the EPP of employment status are included.
Initial Completers
| Year | Certified | FT Teacher | PT Teacher | State Substitute | Other/Unknown |
|---|---|---|---|---|---|
2024-2025 May 25 completers | N=283 | 177 | 8 | 4 | 94 |
2023-2024 May 24 completers | N=319 | 85 | 9 | 4 | 221 |
2022-23 May 23 completers | N=260 | 225 | 9 | 2 | 24 |
This table reflects employment data based on licensure recommendations made by the EPP and respondents to the Nebraska Department of Education 1st Year Teacher Survey.
Initial Completer Employment Status by Content Area for 2024-2025 (2023-2024 completers)
Please note that candidates may be included in counts for more than one subject area if they completed multiple programs, but are only counted once in the employment data (i.e., a candidate prepared in Elementary Education & Special Education is counted as a completer in both programs but only counted in the area in which they are employed). Employment data is based on survey information and licensure verifications for certification. Completers may be counted in the Other/Unknown column if they chose other fields of employment, pursued of out of state licensure without verification or failed to report their plans/employment status.
| Endorsement Area | Completers | FT/PT | Other/Unknown |
| Agricultural Education | 14 | 13 | 1 |
| Biology | 2 | 2 | 0 |
| Business, Marketing, Info Tech | 4 | 3 | 1 |
| Chemistry | 3 | 2 | 1 |
| Early Childhood Inclusive | 5 | 5 | 0 |
| Earth & Space Science | 1 | 1 | 0 |
| Elementary Education | 100 | 87 | 13 |
| Special Education | 34 | 32 | 2 |
| English Language Arts/Secondary English | 21 | 18 | 3 |
| FCS Occupational | 6 | 5 | 1 |
| Math | 13 | 11 | 2 |
| Music (Nationally Accredited) | 28 | 26 | 2 |
| Physics | 1 | 1 | 0 |
| Science | 2 | 2 | 0 |
| Social Science | 34 | 29 | 5 |
| Skilled & Technical Sciences | 3 | 3 | 0 |
| Early Childhood Special Education | 8 | 8 | 0 |
| World Language | 2 | 2 | 0 |
2024-2025 Initial Completers are employed in the following School Districts for the 2025-2026 School Year:
- Ashland Greenwood Public Schools
- Battle Creek Public Schools
- Beatrice Public Schools
- Bellevue Public Schools
- Bennington Public Schools
- Chase County Schools
- Crete Public Schools
- Diller-Odell Public Schools
- Elkhorn Public Schools
- Fairbury Public Schools
- Fremont Public Schools
- Hayes Center Public Schools
- High Plains Community Schools
- Lakeview Community Schools
- Lincoln Public Schools
- Malcolm Public Schools
- Meridian Public Schools
- Millard Public Schools
- Newman Grove Public Schools
- North American Martyrs School
- Omaha Public Schools
- Papillion LaVista Community Schools
- Sandy Creek Schools
- Seward Public Schools
- St. Vincent De Paul Elementary
- Sutherland Public Schools
- Waverly School District 145
- Wayne Community Schools
- Westside Community Schools
- Wynot Public Schools
- York Public Schools
Other states initial completers were hired
- Colorado
- Illinois
- Iowa
- Kansas
- Minnesota
- North Carolina
- Oregon
- South Carolina
- South Dakota
- Wyoming
UNL Advanced Program completers are employed in a variety of public and private school districts. Below is information from 2023-2024 completers who have obtained endorsements from the Nebraska Department of Education in the fields of their preparation, qualifying them for positions for which they may be employed. A list of districts employing our advanced completers is also included.
Advanced Program Completers Hiring
UNL Advanced Program completers are employed in a variety of public and private school districts. Below is information from 2024-2025 completers who have licensure in the advanced endorsements from the Nebraska Department of Education in the fields of their preparation. A list of districts employing advanced completers is also included.
Educational Administration
- Superintendent: 3 completers obtained Nebraska licensure with the Nebraska Department of Education.
- Principal: 20 completers obtained licensure as a principal with the Nebraska Department of Education and serve in various administrative roles; 7 completers obtained licensure as a principal and remain in teaching positions.
Special Education Graduate Endorsement
- Visual Impairment: 5 completers obtained licensure; 2 completers obtained out of state licensure and 3 were issued licensure by the Nebraska Department Education.
- Orientation & Mobility: 3 completers obtained licensure; 2 completers obtained out of state licensure and 1 was issued licensure by the Nebraska Department of Education.
- Dearf or Hard of Hearing: 8 completers obtained licensure; 3 completers obtained out of state licensure and 5 were issued licensure by the Nebraska Department of Education.
Reading Specialist Graduate Endorsement
- There were no completers in 2024-2025.
Speech Language Pathologists Program (nationally accredited by ASHA)
- 20 completers obtained licensure; 1 completer obtained out of state licensure and 19 were issued licensure by the Nebraska Department of Education.
School Psychology Program (nationally accredited by NASP)
- 8 completers obtained licensure; 1 completer obtained out of state licensure and 7 were issued licensure by the Nebraska Department of Education.
2024-2025 Advanced Program Completers in the UNL educator preparation program are employed in the following districts for the 2025-2026 school year:
- Adams Central Public Schools
- Battle Creek Public Schools
- Cedar Bluff Public Schools
- Centennial Public Schools
- Fairbury Public Schools
- Gering Public Schools
- High Plains Community Schools
- Isanti Community School
- Lincoln Public Schools
- Malcolm Public Schools
- Millard Public Schools
- Minden Public Schools
- North American Martyrs
- North Platte Public Schools
- Omaha Public Schools
- Papillion LaVista Community Schools
- UMÓⁿHOⁿ Nation Public School
- Westside Community Schools
- Yutan Public Schools
Other states in which completers hold employment:
- Colorado
- Illinois
- Iowa
- Kansas
- Massachusetts
- Minnesota
- North Carolina
- Oregon
- Pennsylvania
- South Carolina
- South Dakota
- Tennessee
- Wisconsin
- Wyoming